Hello everyone, today we will share with you a very detailed and precise guide about what exactly Azure Monitor is and how it can help you or your business/company improve your performances but utilizing all of its abilities and features..
We here at Oxavi Group Inc have been utilizing Azure for the past few years and honestly, it has made our lives much easier, I wish we knew about Azure way back and we thank Microsoft for being serious and regularly adding new options and features to Azure which fortunately for all of us using Azure, they have included services like Azure Monitor as part of the core. As it is now, monitoring your data is critical and this tool helps you with that in so many ways. Below we will give you a quick overview of how Azure Monitor can help you and make life easier.
What Is Azure Monitor?
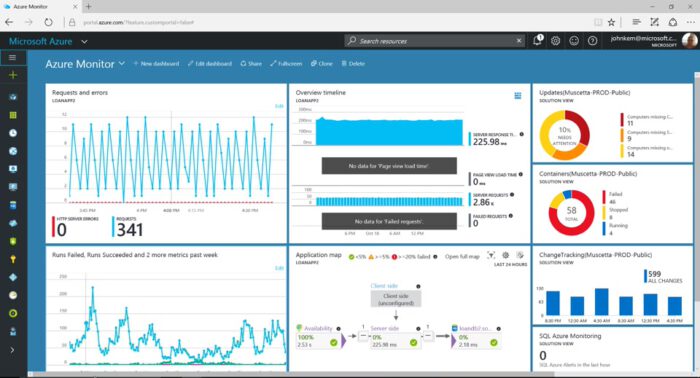
Azure Monitor maximizes the availability and performance of your applications and services by delivering a comprehensive solution for collecting, analyzing, and acting on telemetry from your cloud and on-premises environments. It helps you understand how your applications are performing and proactively identifies issues affecting them and the resources they depend on.
Azure Monitor Features:
- Detect and diagnose issues across applications and dependencies with Application Insights.
- Correlate infrastructure issues with Azure Monitor for VMs and Azure Monitor for Containers.
- Drill into your monitoring data with Log Analytics for troubleshooting and deep diagnostics.
- Support operations at scale with smart alerts and automated actions.
- Create visualizations with Azure dashboards and workbooks.
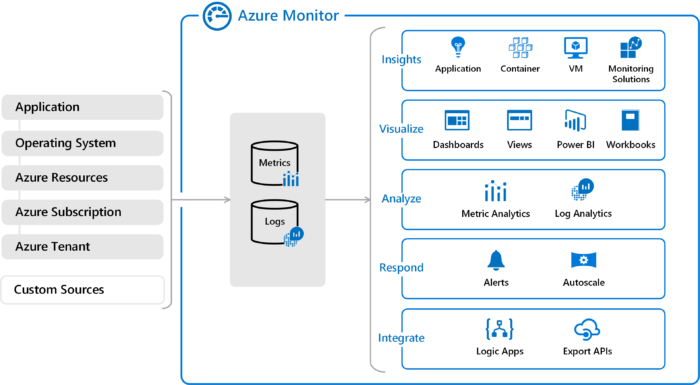
The following diagram gives a high-level view of Azure Monitor. At the center of the diagram are the data stores for metrics and logs, which are the two fundamental types of data use by Azure Monitor. On the left are the sources of monitoring data that populate these data stores. On the right are the different functions that Azure Monitor performs with this collected data such as analysis, alerting, and streaming to external systems.
 How Azure Monitor is setup
Azure monitoring data platform
All data collected by Azure Monitor fits into one of two fundamental types, metrics and logs. Metrics are numerical values that describe some aspect of a system at a particular point in time. They are lightweight and capable of supporting near real-time scenarios. Logs contain different kinds of data organized into records with different sets of properties for each type. Telemetry such as events and traces are stored as logs in addition to performance data so that it can all be combined for analysis.
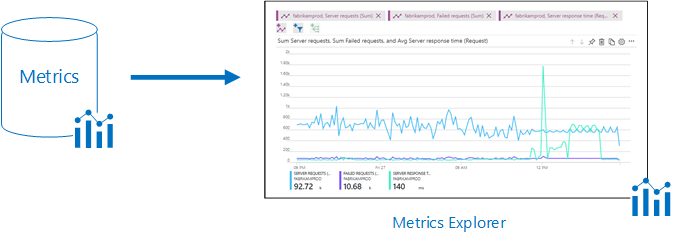
For many Azure resources, you’ll see data collected by Azure Monitor right in their Overview page in the Azure portal. Have a look at any virtual machine for example, and you’ll see several charts displaying performance metrics. Click on any of the graphs to open the data in metrics explorer in the Azure portal, which allows you to chart the values of multiple metrics over time. You can view the charts interactively or pin them to a dashboard to view them with other visualizations.
 Azure Monitor Metrics Data
Log data collected by Azure Monitor can be analyzed with queries to quickly retrieve, consolidate, and analyze collected data. You can create and test queries using Log Analytics in the Azure portal and then either directly analyze the data using these tools or save queries for use with visualizations or alert rules.
Azure Monitor uses a version of the Kusto query language used by Azure Data Explorer that is suitable for simple log queries but also includes advanced functionality such as aggregations, joins, and smart analytics. You can quickly learn the query language using multiple lessons. Particular guidance is provided to users who are already familiar with SQL and Splunk.
What data does Azure Monitor collect?
Azure Monitor can collect data from a variety of sources. You can think of monitoring data for your applications in tiers ranging from your application, any operating system and services it relies on, down to the platform itself. Azure Monitor collects data from each of the following tiers:
- Application monitoring data: Data about the performance and functionality of the code you have written, regardless of its platform.
- Guest OS monitoring data: Data about the operating system on which your application is running. This could be running in Azure, another cloud, or on-premises.
- Azure resource monitoring data: Data about the operation of an Azure resource.
- Azure subscription monitoring data: Data about the operation and management of an Azure subscription, as well as data about the health and operation of Azure itself.
- Azure tenant monitoring data: Data about the operation of tenant-level Azure services, such as Azure Active Directory.
As soon as you create an Azure subscription and start adding resources such as virtual machines and web apps, Azure Monitor starts collecting data. Activity logs record when resources are created or modified. Metrics tell you how the resource is performing and the resources that it’s consuming.
Extend the data you’re collecting into the actual operation of the resources by enabling diagnostics and adding an agent to compute resources. This will collect telemetry for the internal operation of the resource and allow you to configure different data sources to collect logs and metrics from Windows and Linux guest operating system.
Enable monitoring for your App Services application or VM and virtual machine scale set application, to enable Application Insights to collect detailed information about your application including page views, application requests, and exceptions. Further verify the availability of your application by configuring an availability test to simulate user traffic.
NOTE: This is just a summarized guide, continue to read more about Azure Monitor by clicking here.
Other Azure content you might enjoy: Install Azure PowerShell on Windows, Azure Data Studio for Windows & What is Microsoft Azure?
Discover more from Windows Mode
Subscribe to get the latest posts sent to your email.


