Hello everyone, today we have an article that most of you will definitely enjoy reading, especially if you currently using Azure Monitor or you just might be curious about how to use it’s functions and whatnot.
There are quite a lot of options available to get the monitoring job done natively at the Azure portal. In a few cases, there is more than one tool available that does almost the same thing as the other. This article is intended to get you started with Azure monitor and let you understand some of the significant components in it. We also the beginners guide to Azure Monitor article that can also get you up to date fast. Please let us know if you have any questions or comments below, let us begin…
If you have tried to set up monitoring in the Azure portal, you might have faced a situation where one tool-A would require monitoring a resource-R, but if you want to do another monitoring activity on the same resource-R, then you would need to use tool-B. This might certainly lead a user to frustration.
As a newbie, it is good to know that Azure Monitor is the central plane for all monitoring toolsets and it is recommended to get into the habit of starting with Azure Monitor, even if you want to look at metrics, or Application Insights, etc.
At the outset, Microsoft is planning to make Azure monitor as the centralized starting point, for all Azure monitoring toolsets. Some of the other monitoring toolsets are being merged/rolled into Azure Monitor as a whole!
What is Azure Monitor?
“Azure monitor collects data from various sources such as applications, operating systems, Azure resources, etc. in the form of metrics and logs. This data can then be processed to perform various functions such as analysis, visualization, alerting, automation, and integrations.”
A picture is worth a thousand words – the below picture simply sums up what the above definition means:
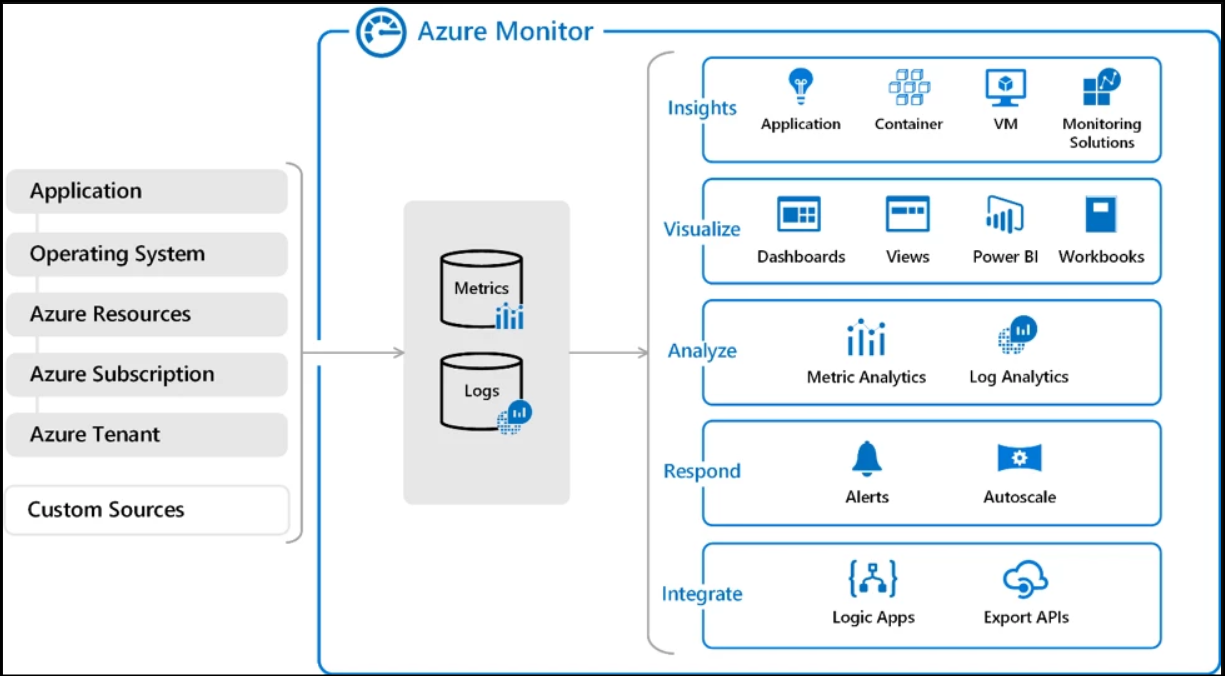
If you read the definition good enough, you would have realized that Metrics and Logs are the core concepts of it and so what are they?
Metrics
Metrics are some numerical values or measurements of an aspect of the Azure resources (say Logic Apps) in some instances. E.g. Trigger failed, Actions succeeded Action latency and more. The value that captured is near real-time and stored in a defined interval. Later, it can be used to visualize in a graphical view to help understand the performance of the resource.
Logs
Log is a collection of organized data transformed into records similar to the structure of your SQL database. Logs can also be a numerical value like metrics but generally, it contains a detailed context in a text format. A good example of logs is events and traces.
The log data that is collected can be queried with KQL (Kusto Query Language) which is the version used by Azure Data Explorer that is suitable to perform simple queries and advanced functionalities such as smart analytics.
If you would like to learn KQL, you can quickly learn through some of the lessons out there. Also, you can analyze the logs that have been collected using Log Analytics in the Azure portal.
What are the data sources of Azure Monitor?
It is also helpful to understand the data sources of the Azure Monitor. It collects data ranging from the application to the custom sources. Yes, Azure monitor can collect data from any REST client using the Data Collector API which certainly opens the custom monitoring scenarios.
Below is the following set of tiers where it can collect monitoring data:
Application – It collects the data about the performance of the underlying code that you have written.
Operating System Data – The data of the OS on which your applications are bound to run.
Azure Resources – The data that has been collected on the operations of Azure resources. In a business context, it is important to monitor the Azure resources data as it is the core part of your application.
Azure Subscription – The operation data that has been performed at the subscription level.
Azure Tenant – The data about the operations done on the Tenant level service, like Azure AD.
Custom Source – The operations data from any REST client outside the Azure environment.
As we have seen above, it is certainly significant to monitor the data of your Azure Resources in a business context. For instance, it is important to keep track of your Service Bus dead-lettered messages piling up and take appropriate actions onto it.
But one of the significant impediments that the users face is to monitor the resources in the application context. Assume you are in an Enterprise organization where you have 100’s of Azure resources like Logic Apps, Service Bus, Azure Functions, Event Grid, and much more.
Azure Monitor only lets you monitor at the resource level and not at the application level, which might not be sufficient for a Support person in your organization to figure out the issue out of the box in an application.
Even worse, if you want to monitor the Azure Functions, you will need to switch to another tool called Application Insights. Monitoring Azure Functions using Azure Monitor is not possible. As an IT Consultant, you would require mastering more than one tool to explain and recommend one to your customer.
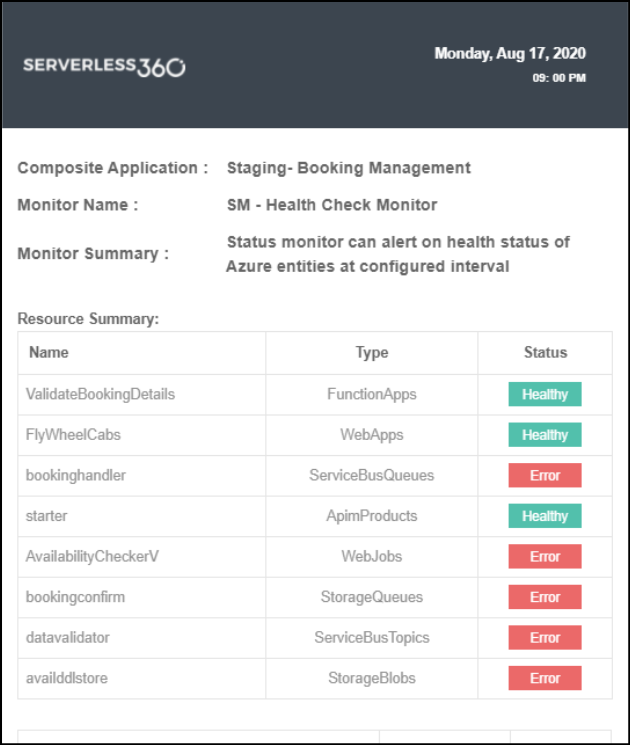
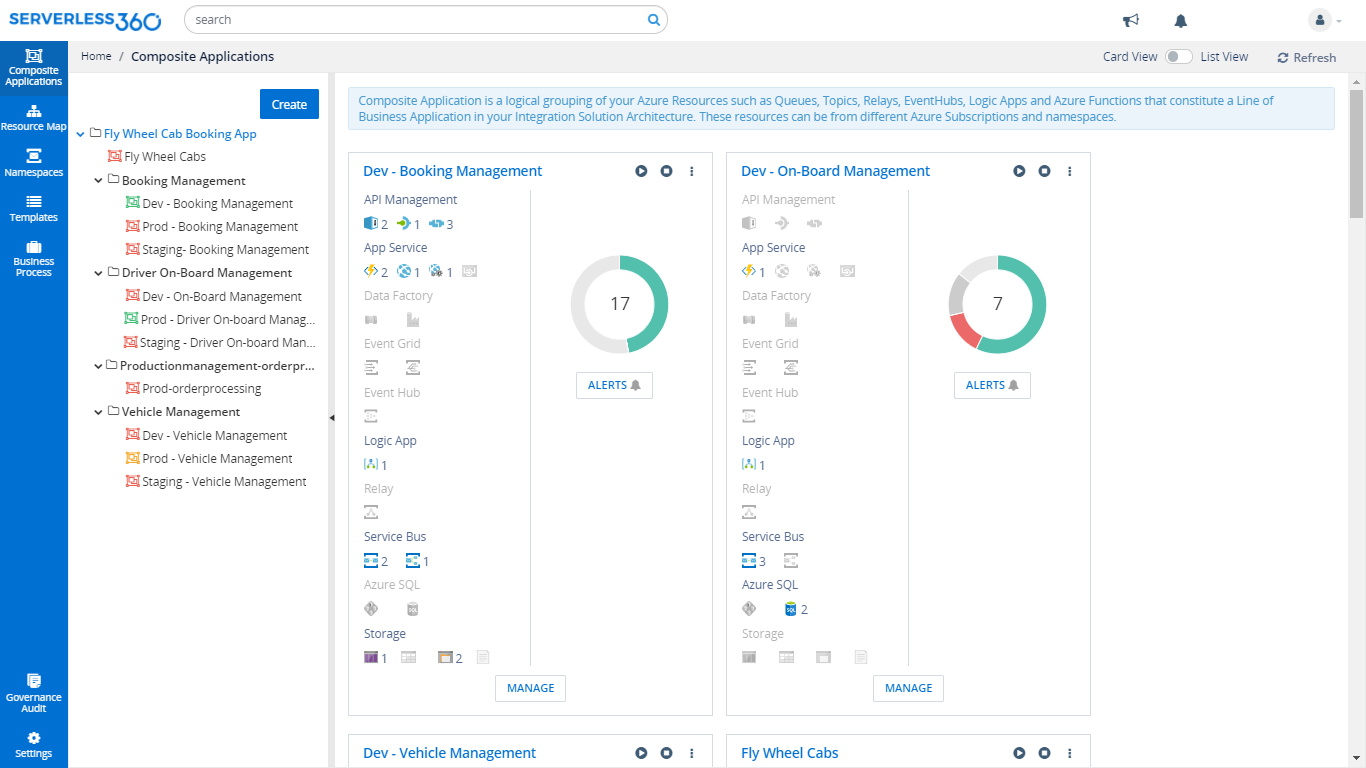
Also, it gives you a holistic view of your Azure resources at the application context with its unique feature called Composite Application. Further, it allows you to monitor multiple metrics, resources in single alerts which is certainly not possible with Azure Monitor.
Significant components of Azure Monitor
Once you had headed to Azure Monitor by searching for it in the global search bar, you can notice the following options in the left navigation pane.
- Activity log
- Alerts
- Metrics
- Logs
- Service Health
Though the important components of the Azure Monitor are Alerts, Metrics, and Logs. We will also investigate the Activity log and Service Health in addition to Application Insights.
Alerts
Alerts notify you of critical conditions and potentially take corrective automated actions based on triggers from metrics or logs.
You can create an alert just by navigating to the “Alerts” options from the left panel in the Azure Monitor section and clicking on the +Add alerts option in the new window.
Follow the steps below to successfully create a new alert:
- Initially, you need to define the scope of the target resource you need to monitor and click done.
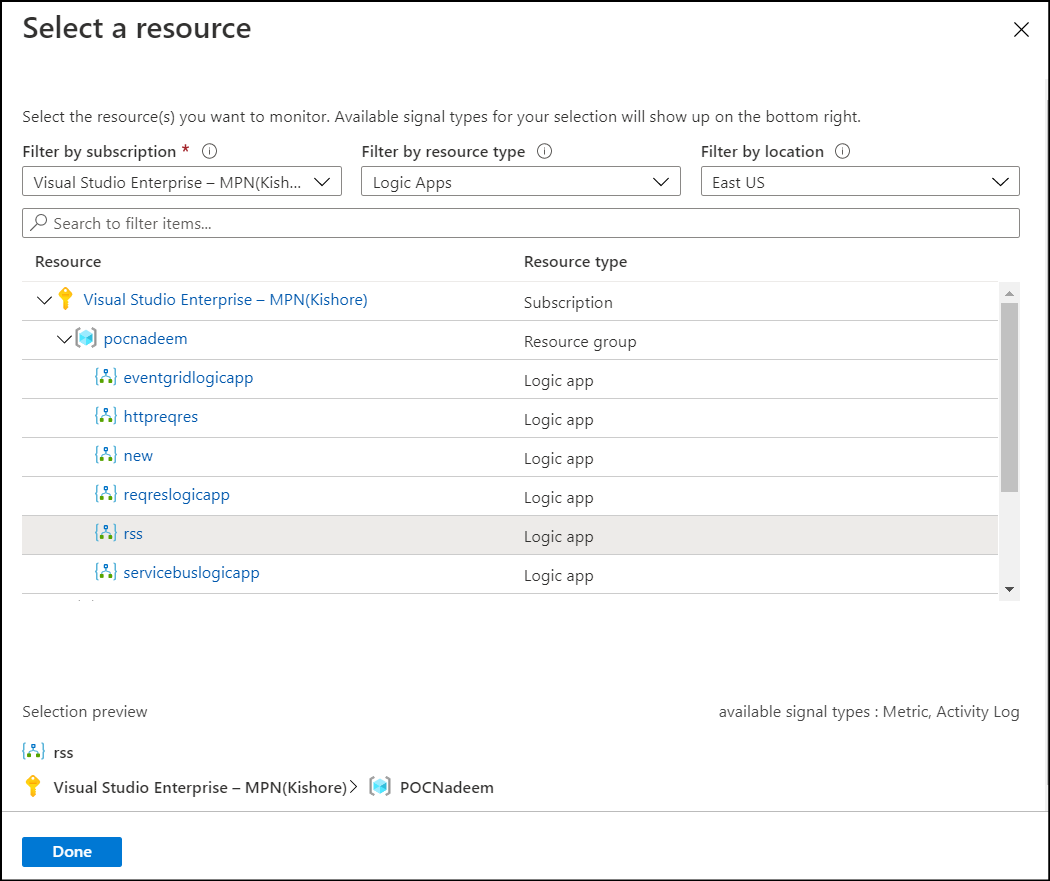
- Then you need to configure the condition defining when your alert should trigger. Select the signal type as either Metric or Activity log and the desired metric to monitor.
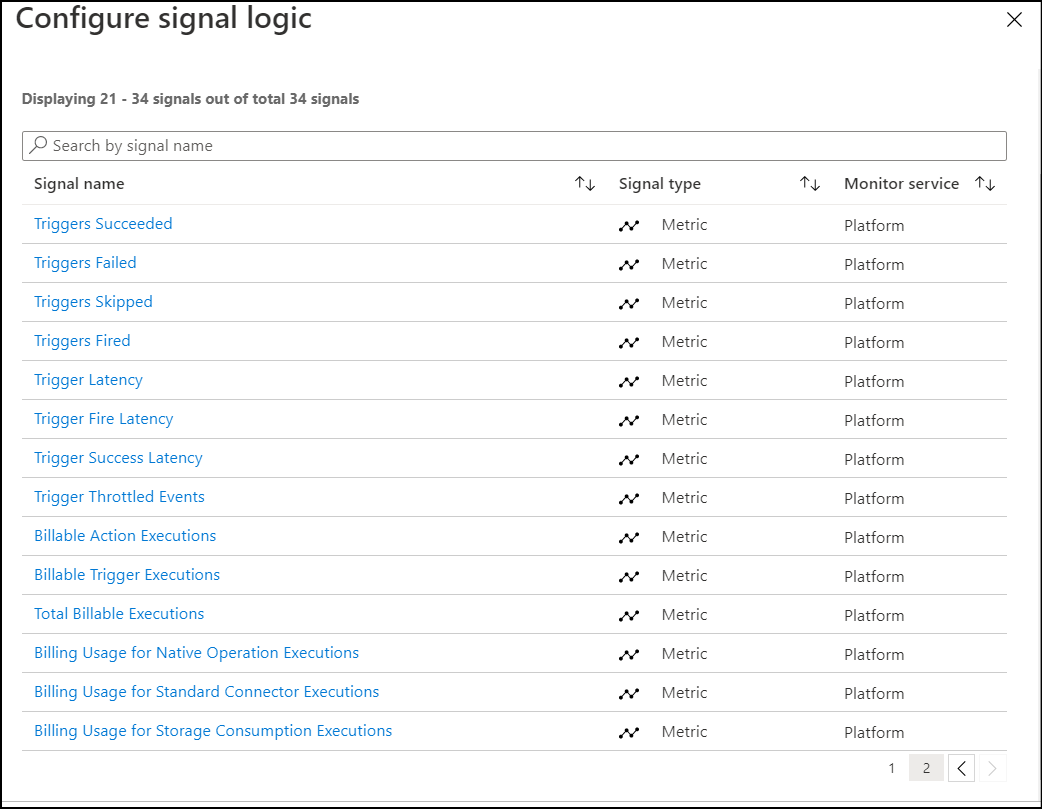
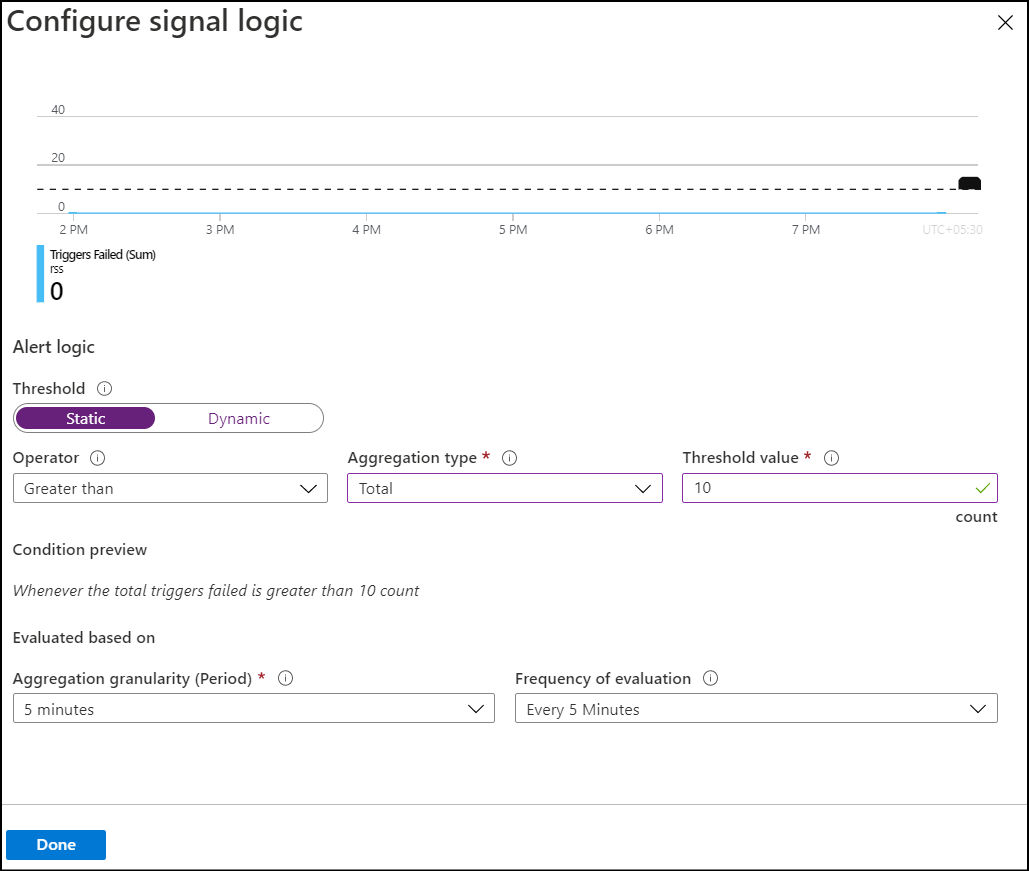
- Secondly, you must define the alert logic and click done.
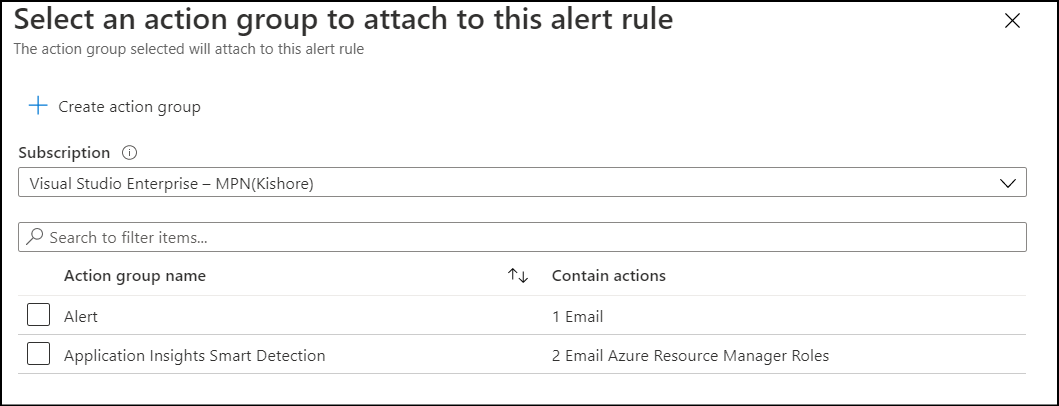
- Now, you need to choose an action group that defines where you would like to get notified.
- Lastly, you need to define the alert rule details like name, description, resources group, and the severity.
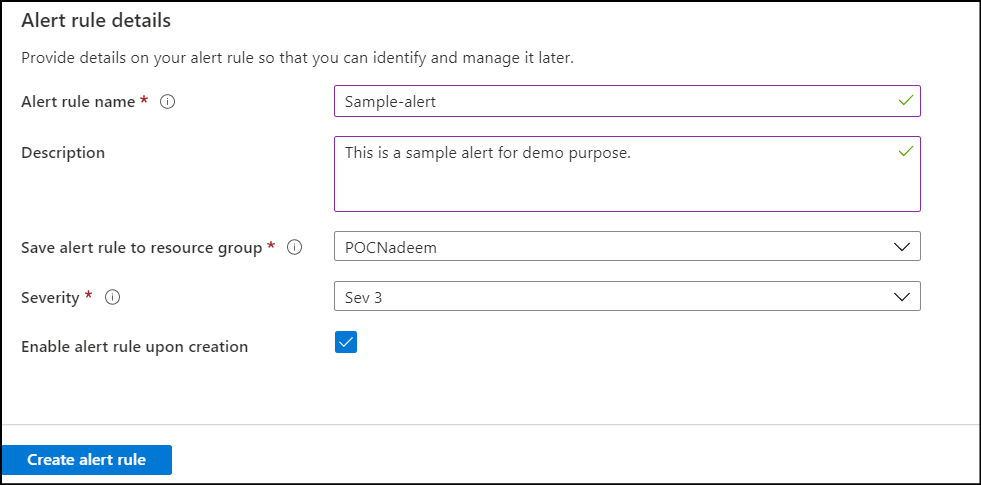
Whenever there is a violation in the configured alert, you will be notified through the configured notification channel.
Metrics
Metrics are numerical values available from Azure Resources helping you understand the health, operation & performance of your systems.
You can visualize a graphical metric of a resource by just navigating to the “Metrics” options from the left panel in the Azure Monitor section.
Follow the steps below to successfully create a new graphical chart of an Azure resource (Say Logic Apps);
- First, you need to define a scope of the resource
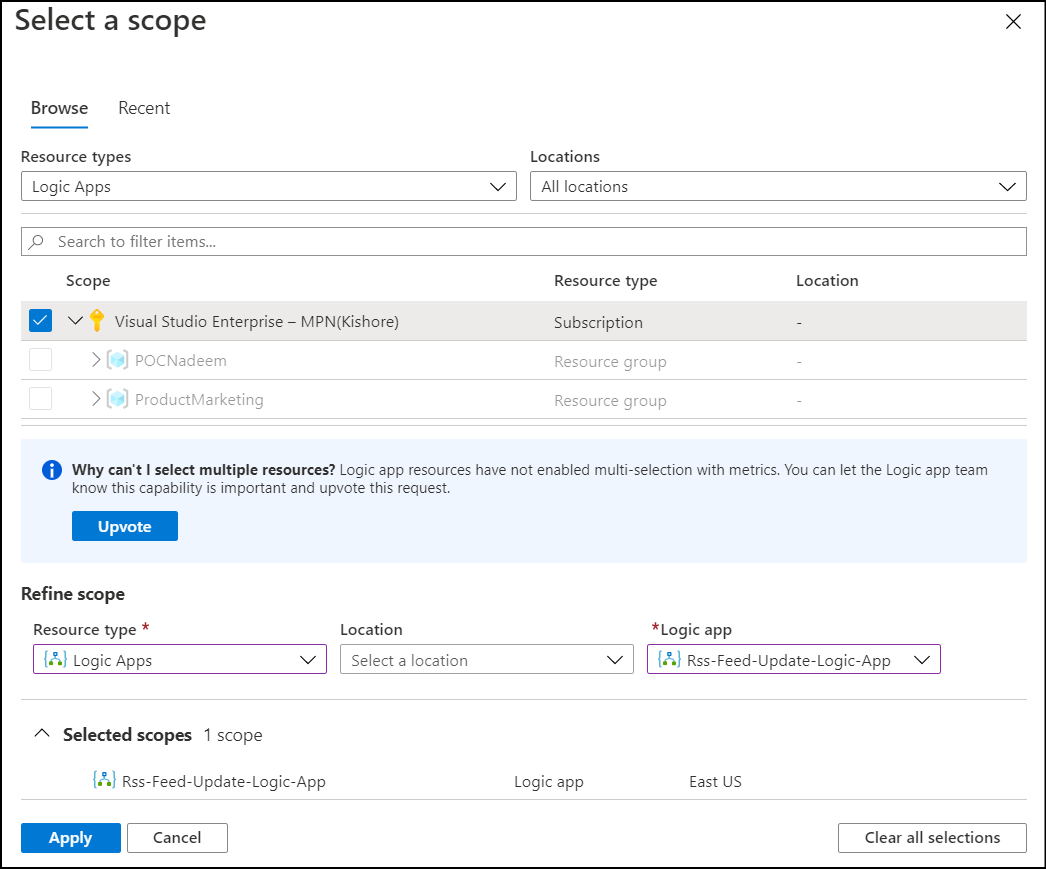
- Now, you should define the metric that you would like to visualize graphically and the aggregation value either as a max, min, sum, etc.

Now, you should be able to visualize the metric in a graphical view for further examination.
Logs
Logs are activity logs, diagnostic logs, and telemetry from monitoring solutions; Analytics queries help with troubleshooting & visualizations.
You can query the logs just by navigating to the Logs option in the left pane of Azure Monitor.
Follow the below steps to successfully query against the logs data of your Azure resource:
- First, you must define the scope of your resource. In this example, I will show you how to query the logs of Logic Apps which is associated with Log Analytics, and further you can use the same to investigate more on your logs. So, let us create one.
- Search for Log Analytics in the global search bar and select it. Now, choose the +Add option to create a new workspace in the new window that pops up.
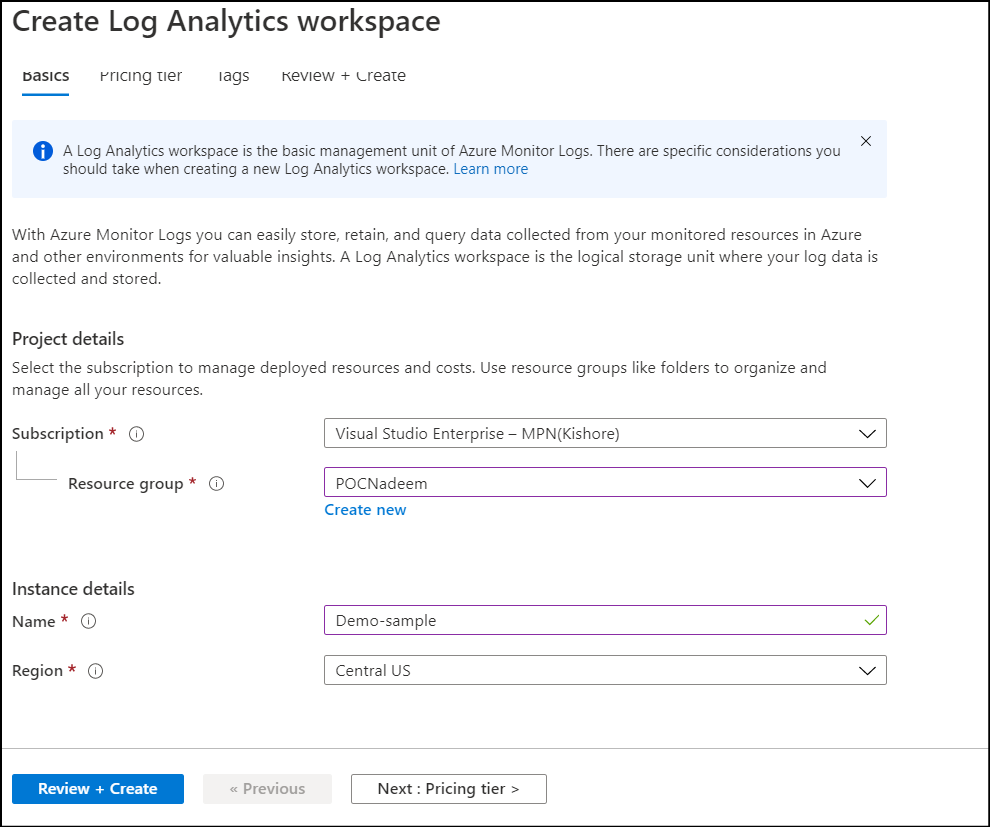
- Once it is created, go to the newly created Log Analytics where you can find the workspace summary option in the left pane. Click on that option and select +add to associate the Logic App management preview solution from the Marketplace.
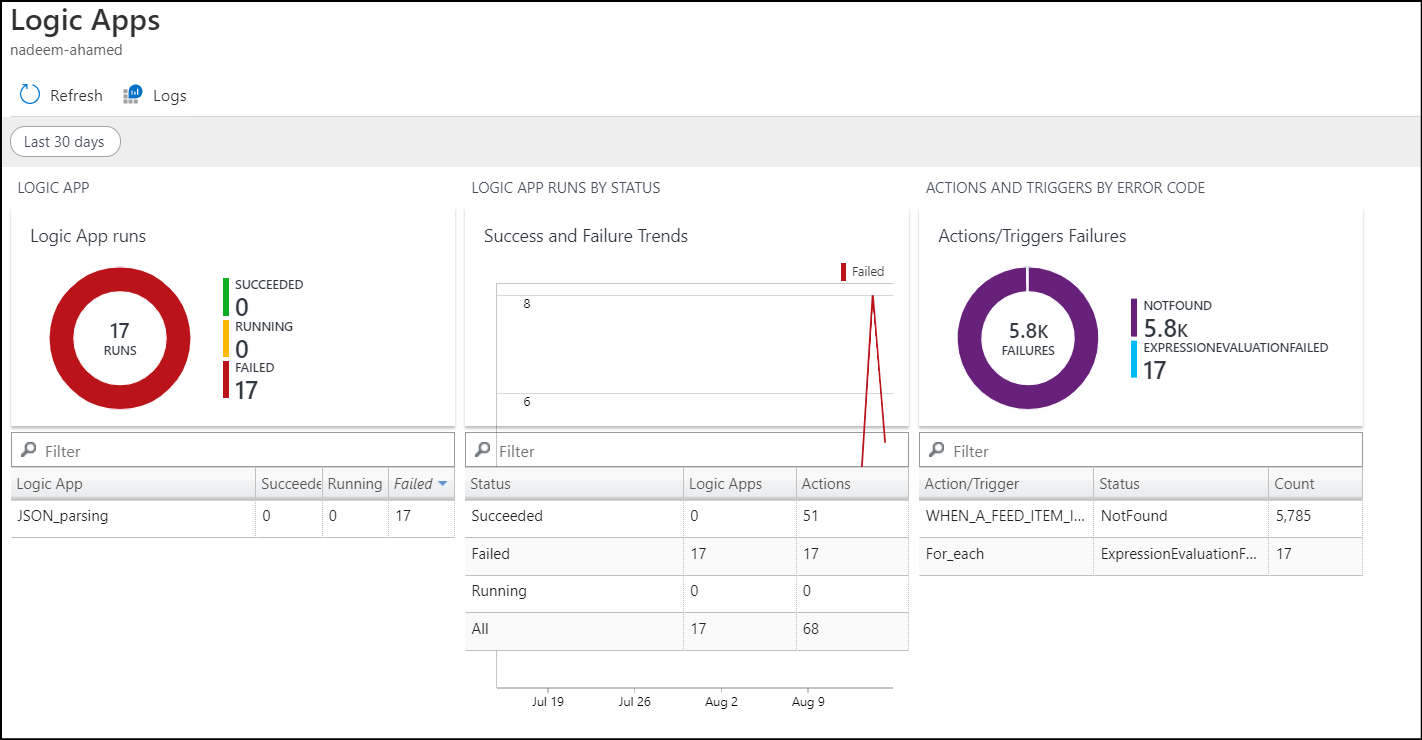
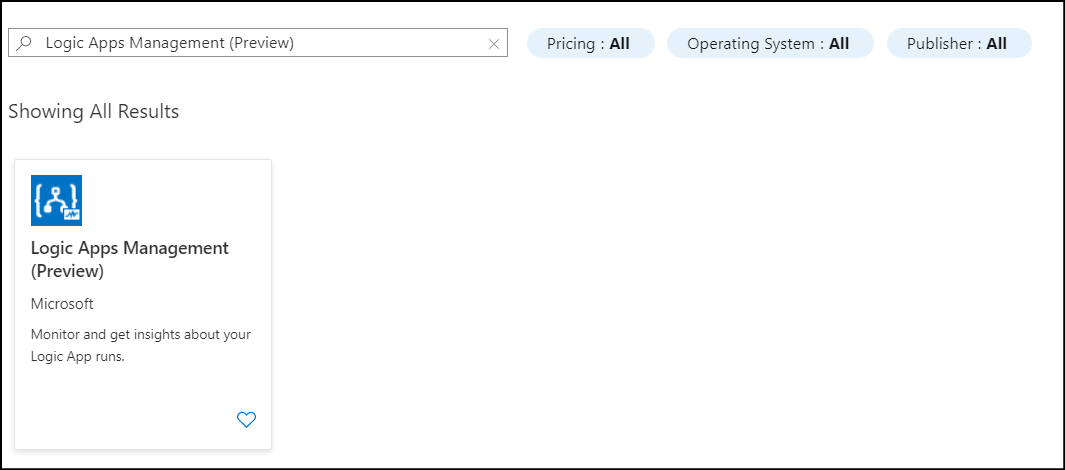 The Logic Apps Management Solution allows you to monitor and manage your Logic Apps. This solution provides you a summary of the overall health of your Logic Apps, with options to drill into details and to troubleshoot unexpected behavior patterns.
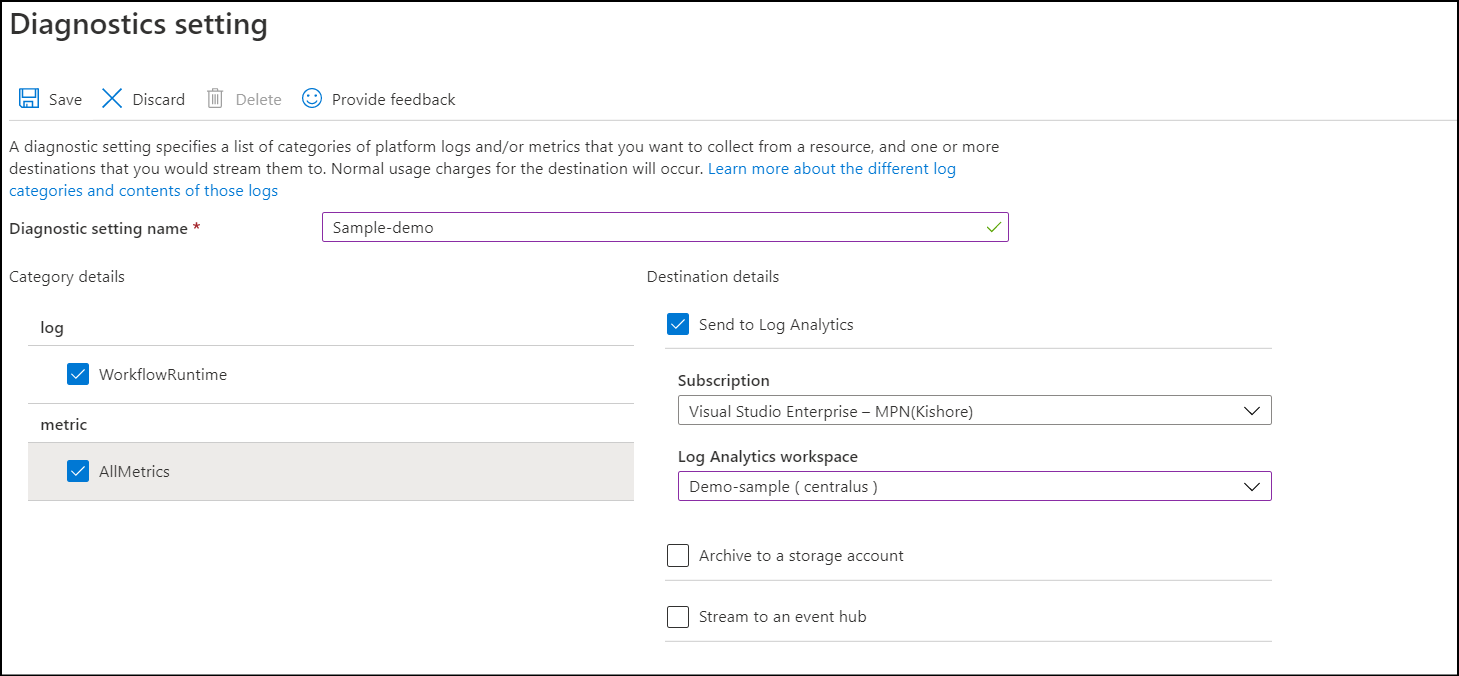
 - Now, head to the desired logic app which you want to associate to the Log analytics. In the left navigation pane of the respective logic app, select the Diagnostic option, and click the +add diagnostic option.
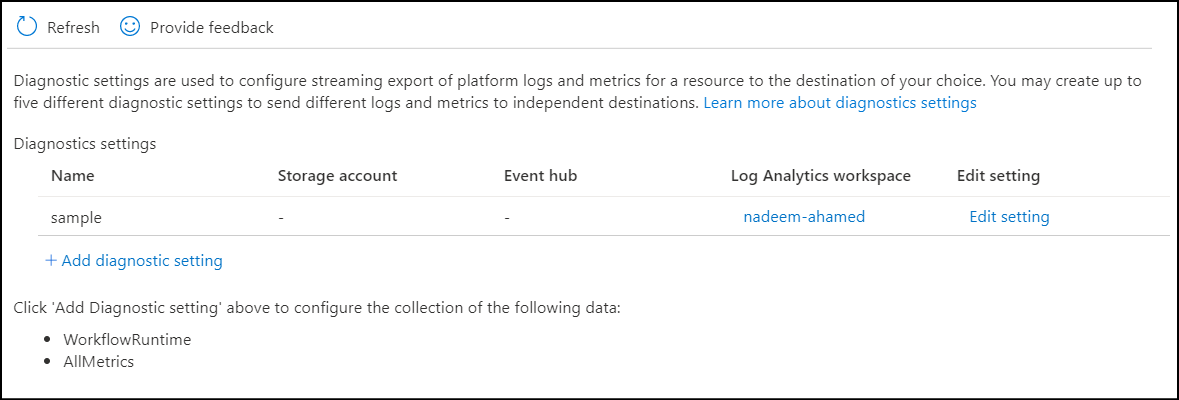
- You will be headed to a window where you must define the diagnostic settings. Fill out the name, destination detail, and category detail. Finally, click Save.
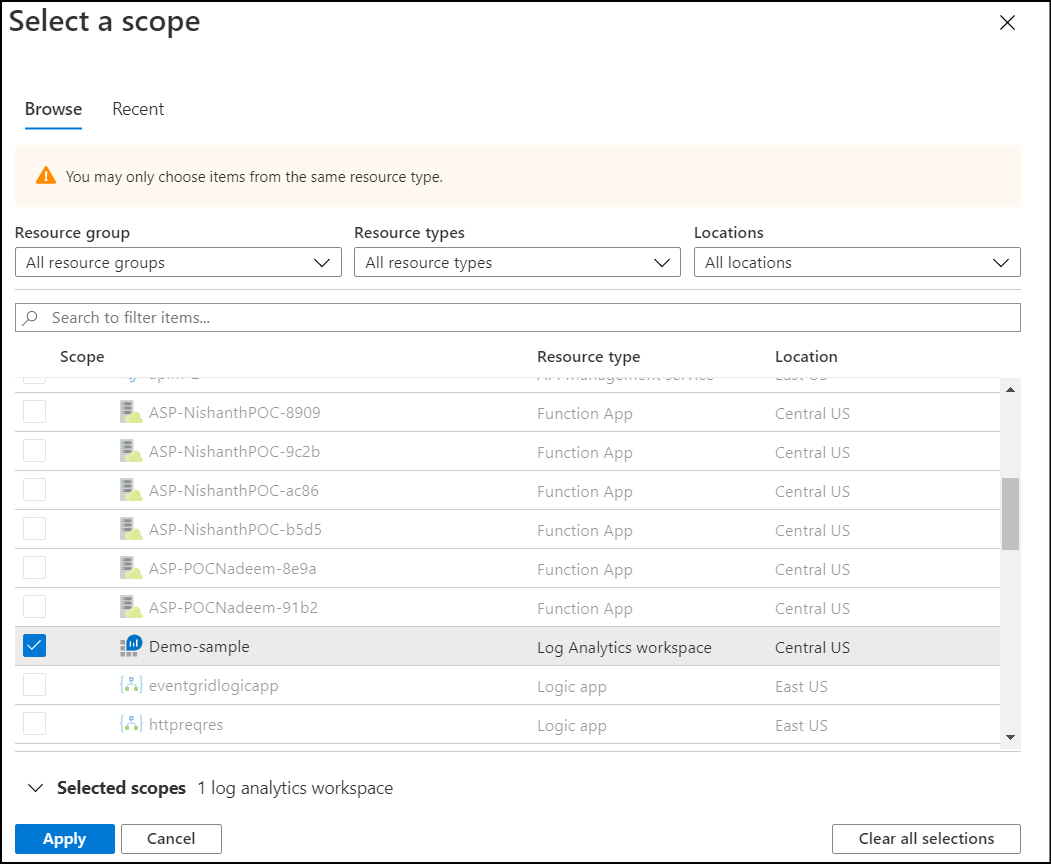
- Now, head back to the Azure Monitor logs and under scope select the recently created Log Analytics workspace. In my case, it is Demo-sample.
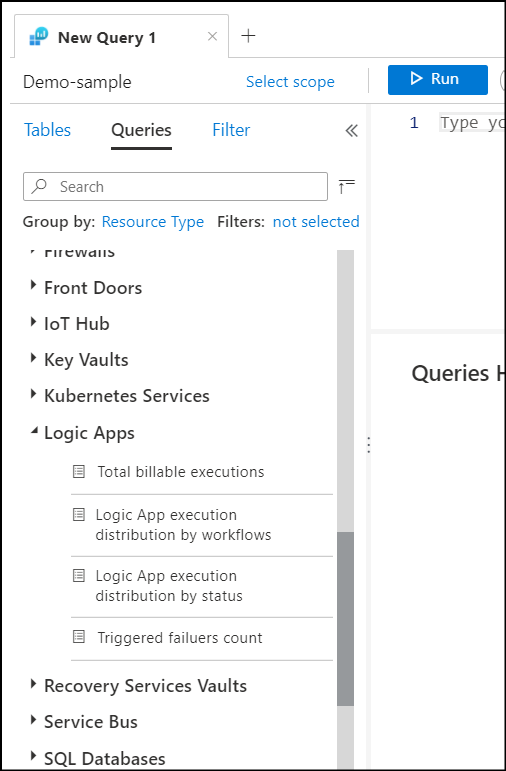
- Now, go to the Queries section and select the resource as Logic apps and total billable execution metric
- On running the automatically generated query, you will be able to see the desired results like the below picture
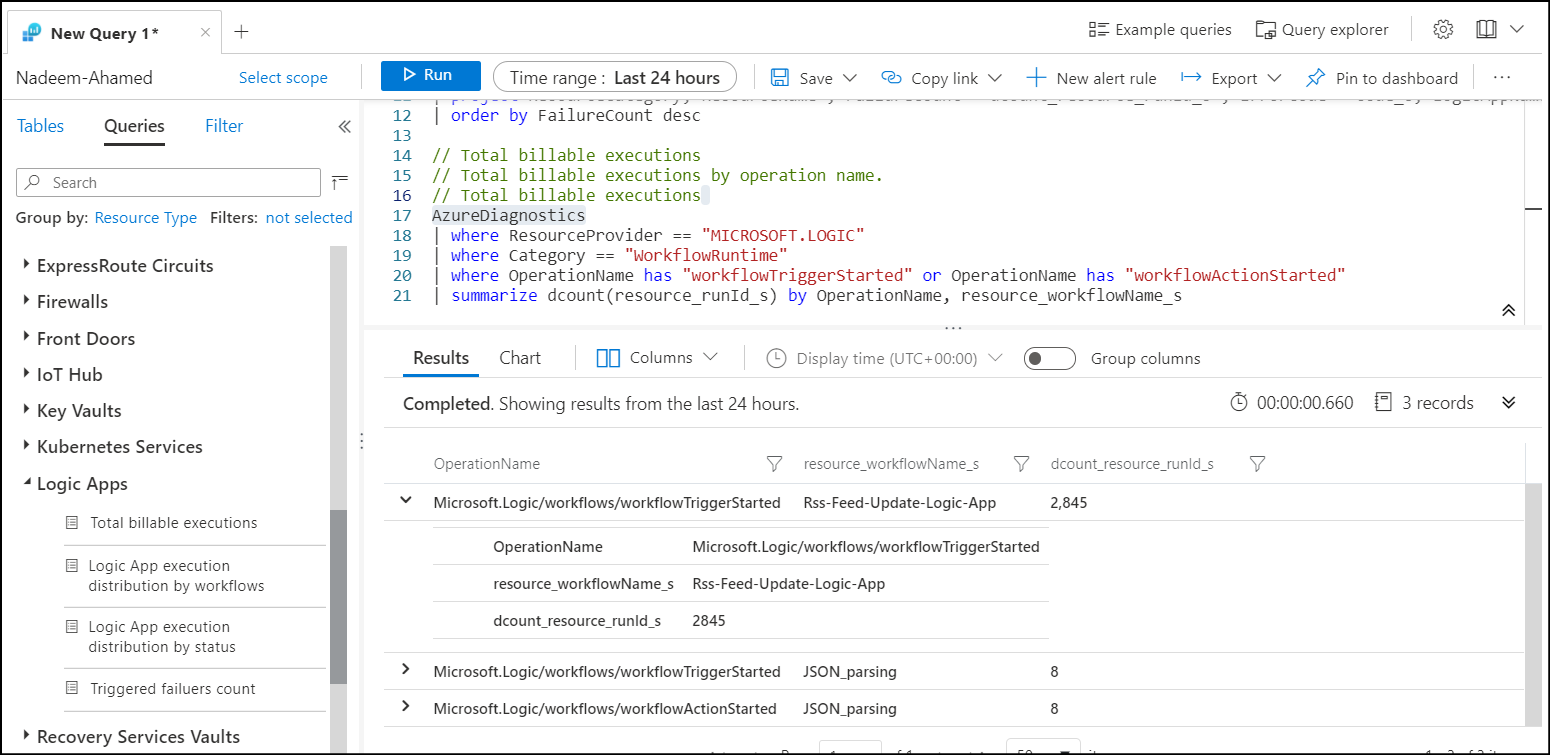
- It shows that there are around 5,672 billable executions occurred in my respective Logic Apps.

As you have also learned how to configure the Logic Apps to Log Analytics, you can visualize the data of the logic apps in the workspace more precisely.
Other things you should know
Here are a few other components in Azure Monitor that are good to know about:
- Activity log
The Azure Activity Log is a part of the Azure Monitor service. In a nutshell, it logs activities that occur at the Subscription level in the Azure environment.
Importantly, the Activity Log is different from Diagnostic Logs. Activity Logs provide data about the operations on a resource from the surface (the “control planes”).
- Service Health
Azure Service Health notifies you about Azure service incidents and planned maintenance, so you’ll take action to mitigate downtime. It allows you to configure customizable alerts and use your personalized dashboard to analyze health issues, monitors the impact on your cloud resources, and much more.
- Application Insights
Monitoring data is merely useful if it can increase your visibility into the operation of your computing environment. Azure Monitor includes several features and tools that provide valuable insights into your applications and other resources that they depend upon. One of the features is Application Insights which monitors the availability, performance, and usage of your web applications whether they’re hosted in the cloud or on-prem.
With that said, I hope you enjoyed this article and we will have many more articles regarding the basics of Azure monitor.
Discover more from Windows Mode
Subscribe to get the latest posts sent to your email.


